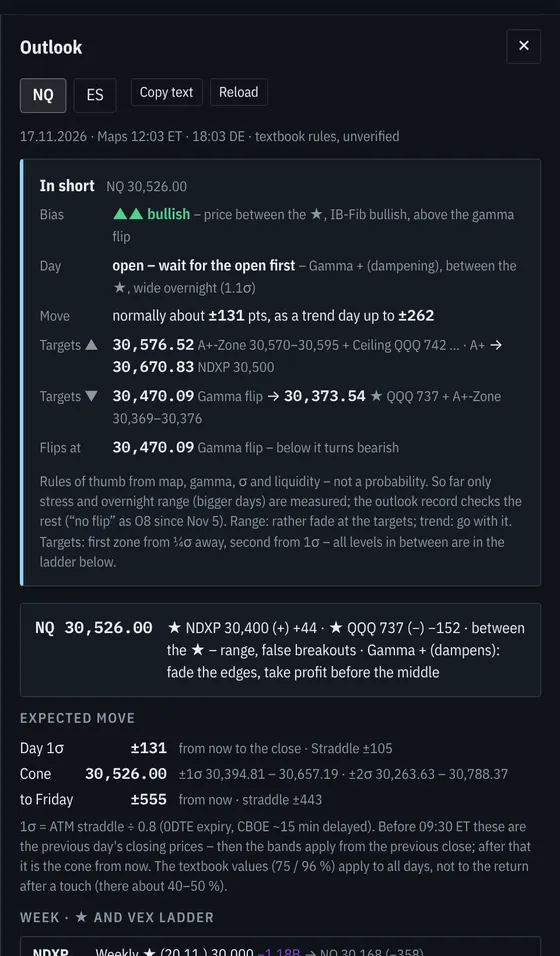
Outlook
Bias, the day's expected move and the targets above and below – rules, written out.
Map, Chart and Replay in one desk. See where the gamma and vanna of NDX, SPX, QQQ and SPY sit – as levels on your NQ and ES chart, updated through the session.
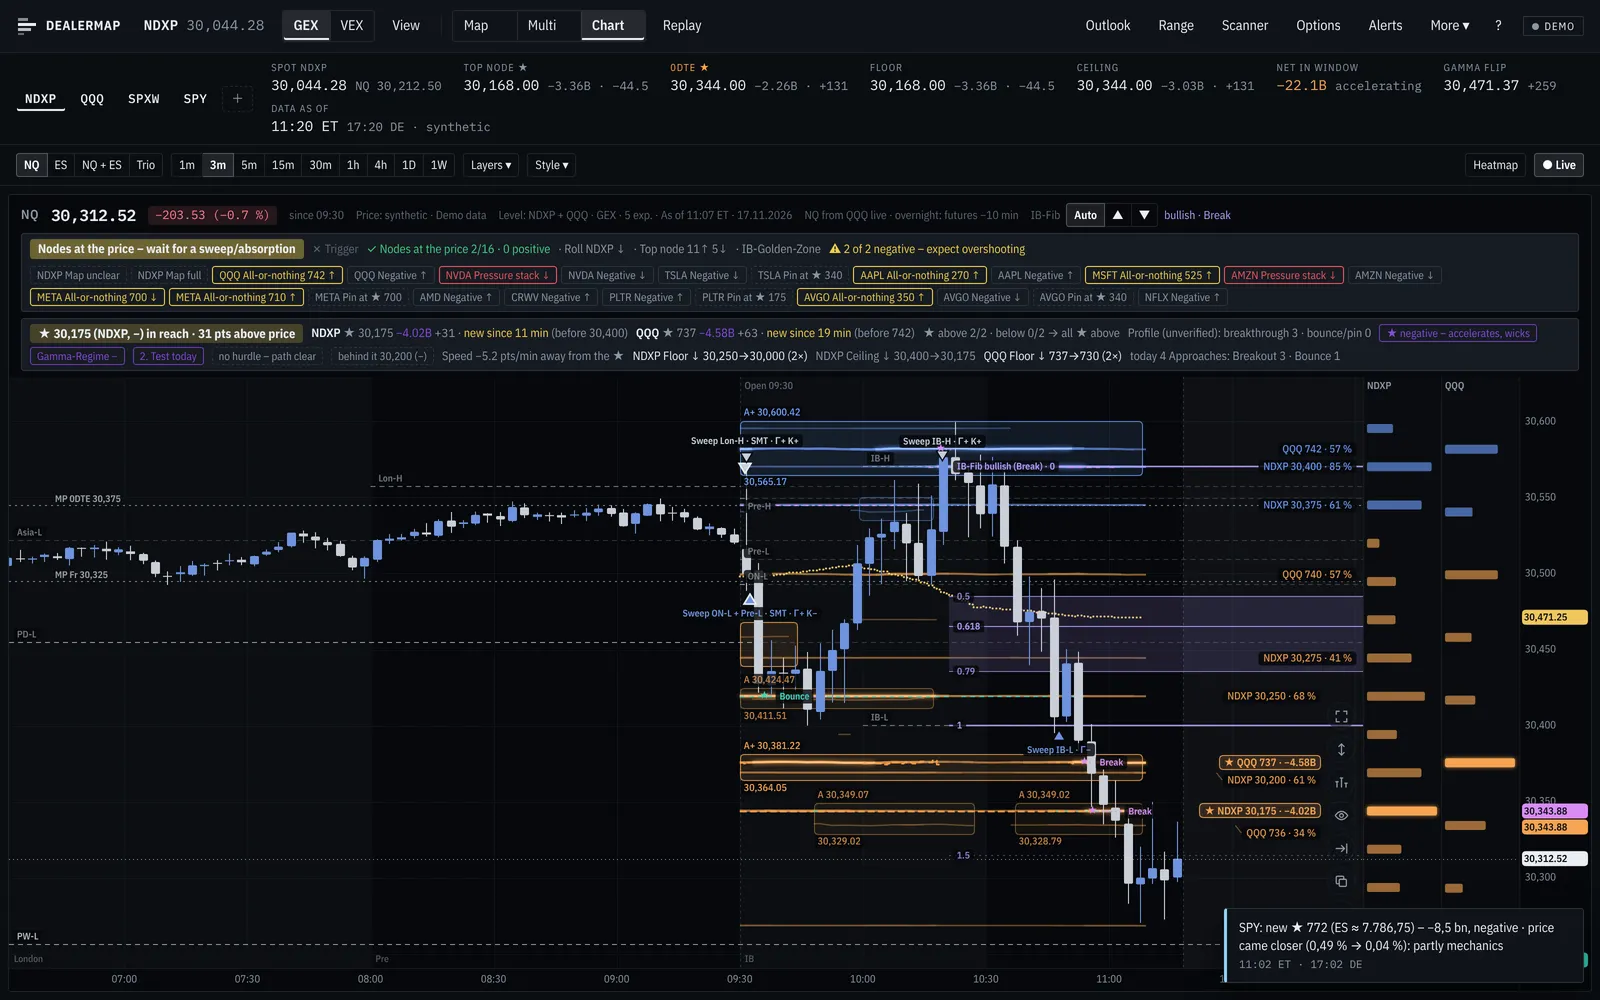
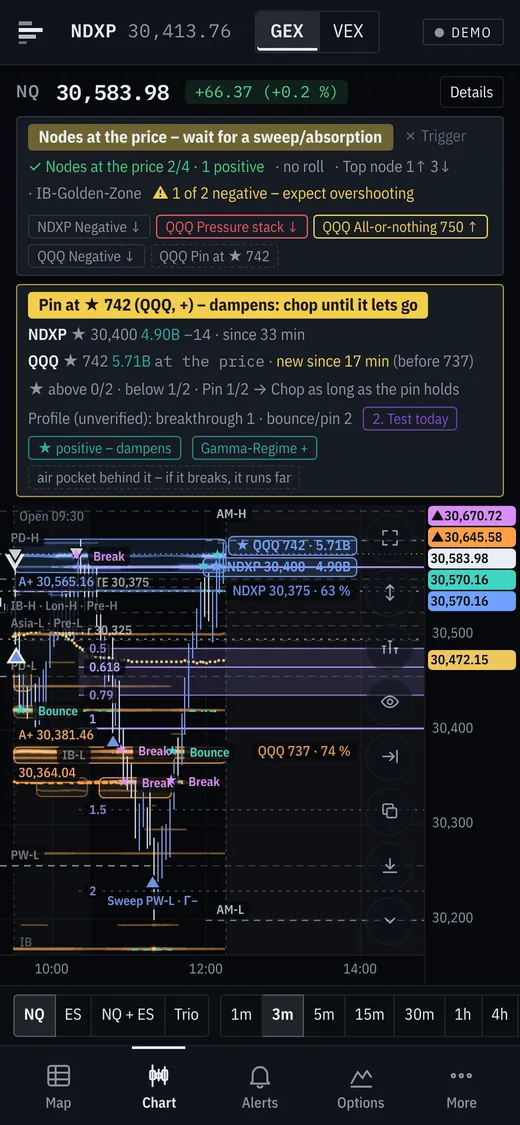
Map, Multi, Chart and Replay share one desk and one clock. Switch views without losing the symbol, the time or your levels.
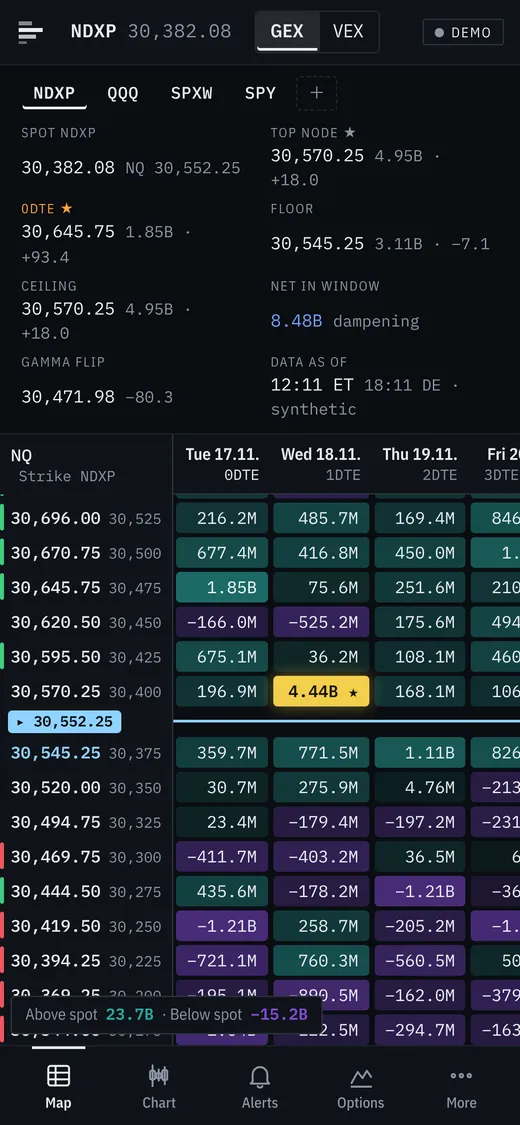
Map · strike × expiry for one symbol. Color is sign, intensity is size, ★ is the largest node.
One grid per symbol: strikes down, expiries across. The cells that matter stand out before you read a number.
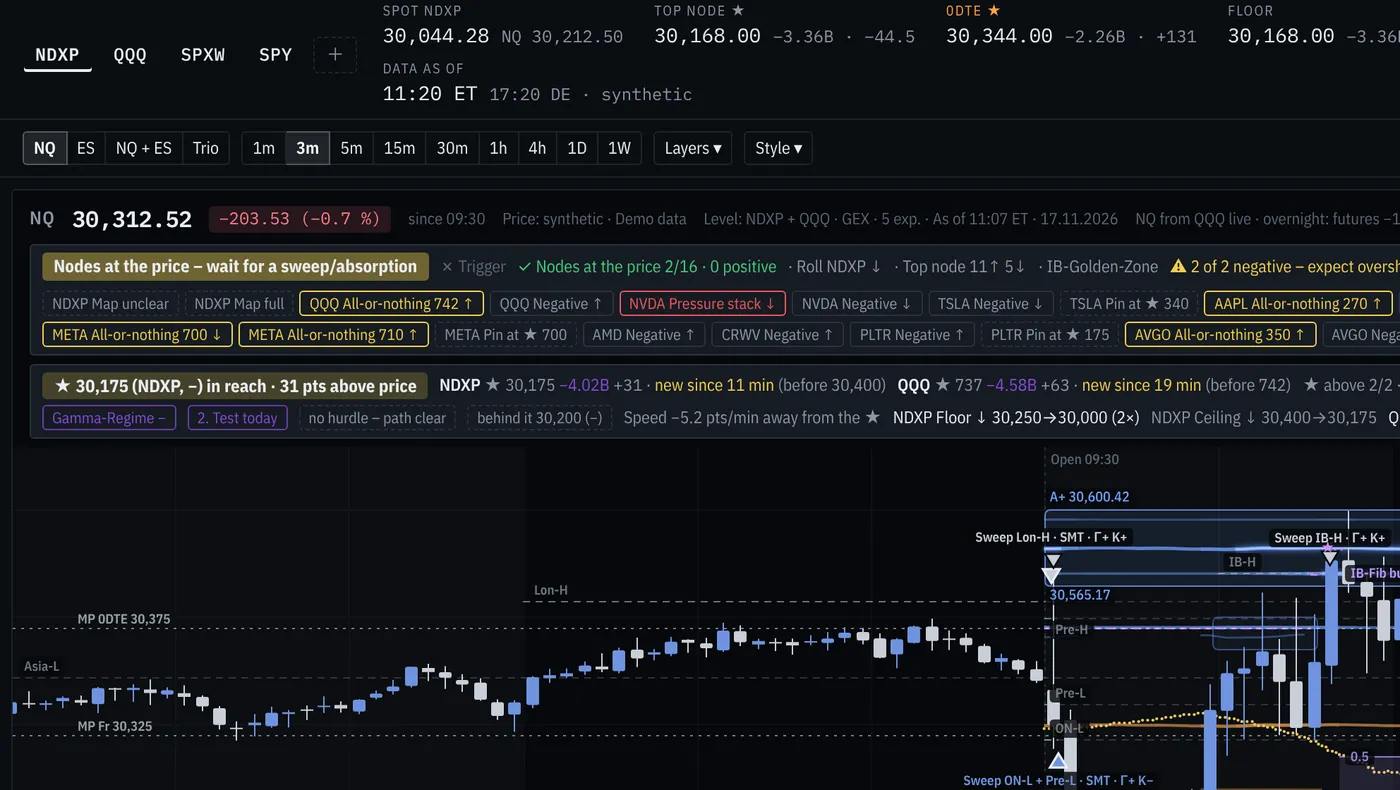
Nodes from index and ETF options in one futures chart, labeled with their size. Range bands from implied volatility show how far the day usually goes.
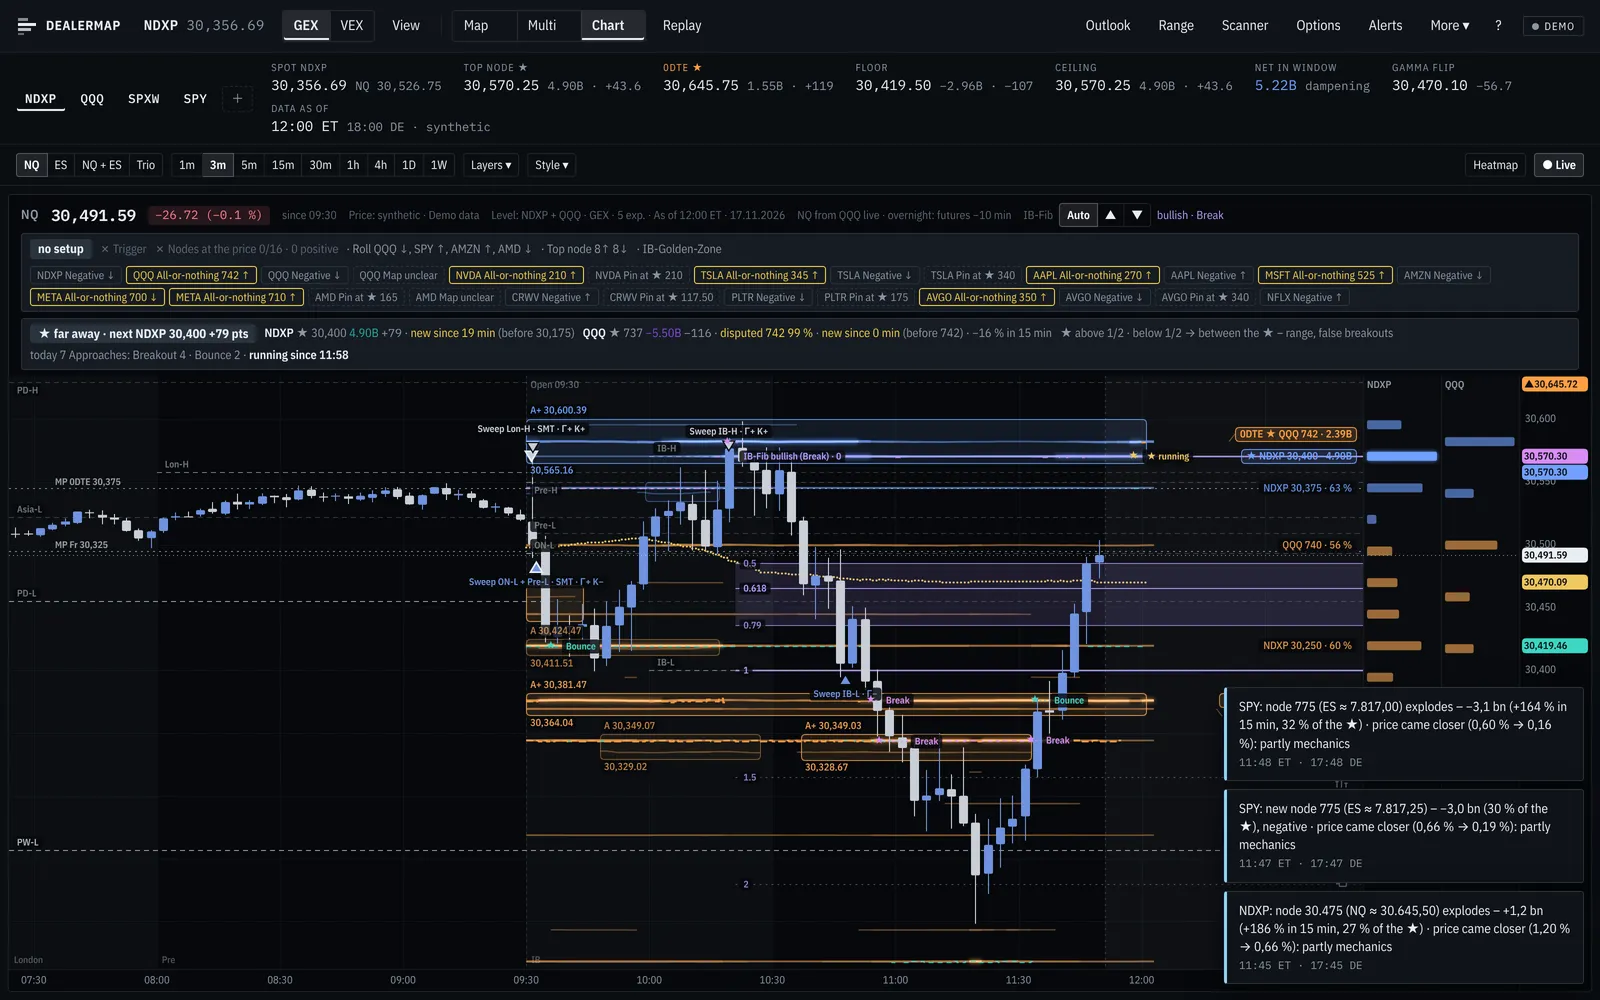
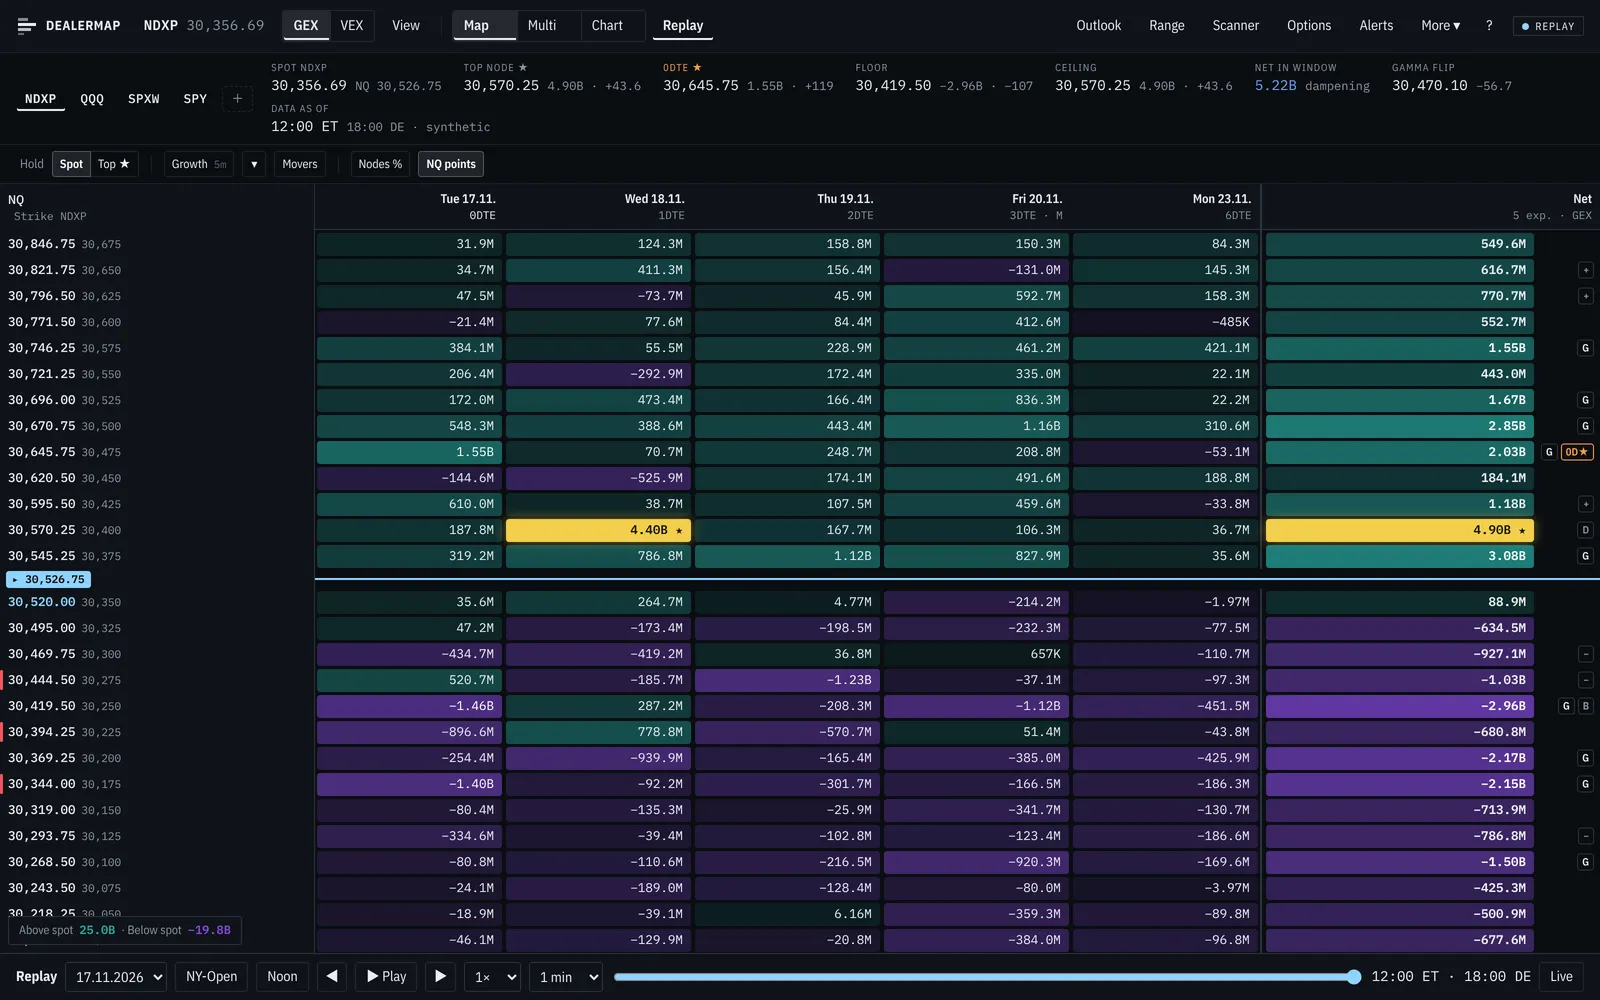
Stored session, demo data · for study, not a forecast.
Outlook, options, alerts – next to the map, on desktop and phone.
Bias, the day's expected move and the targets above and below – rules, written out.
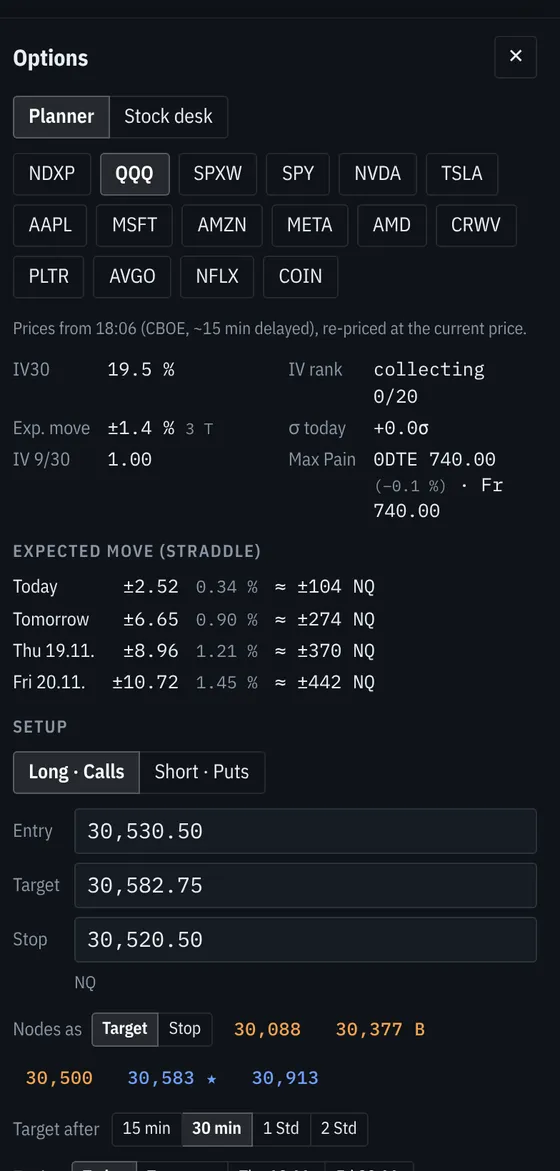
Expected move per expiry and a planner: entry, target, stop – priced from the chain.
The same levels on NQ and ES, made for a small screen.
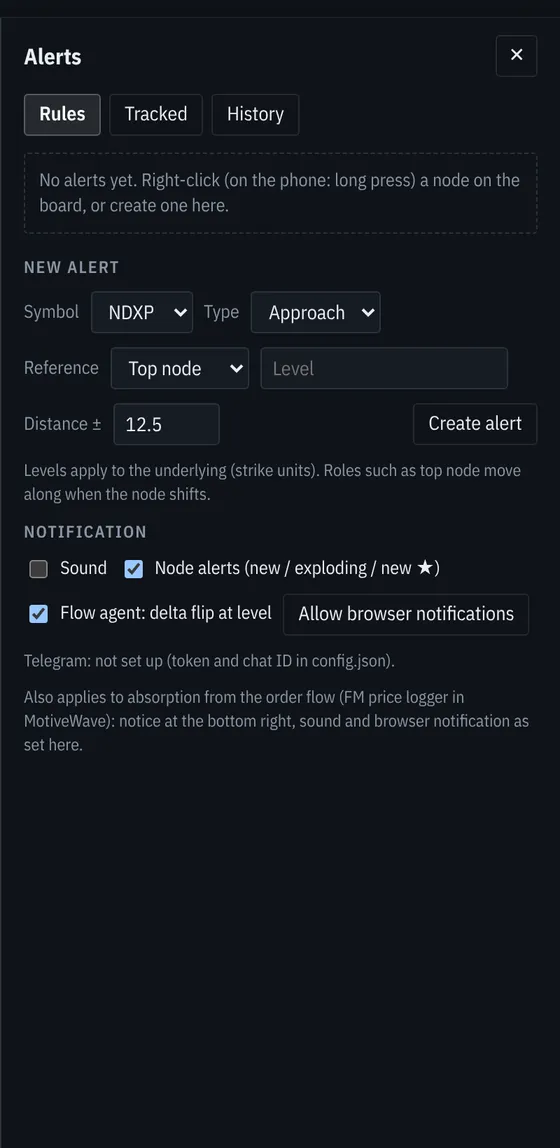
Price and node alerts: approach, new ★, a node that explodes or rolls.
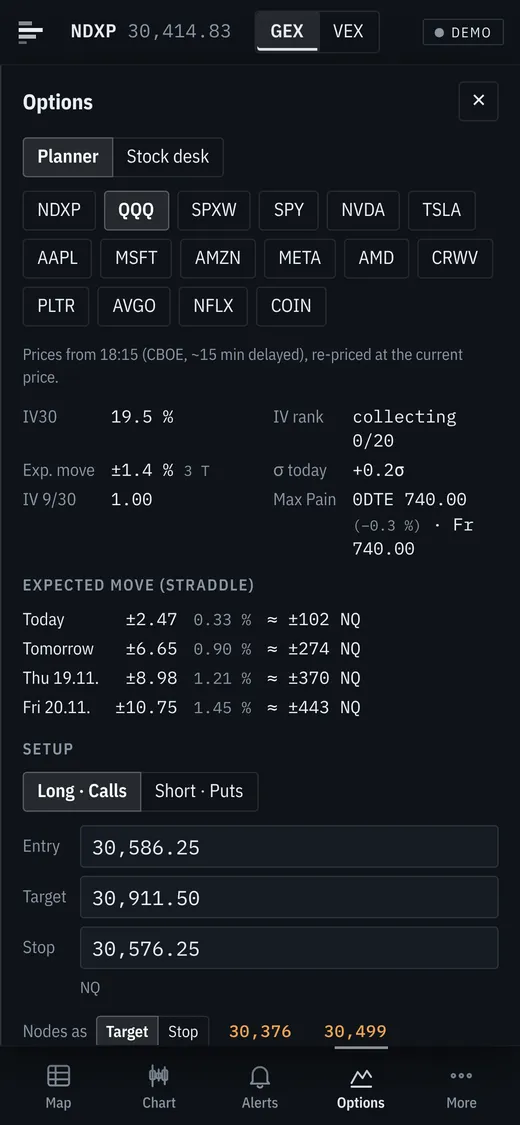
Check a setup between two screens, without opening the desktop.
Swipe or scroll sideways →
Dealermap shows where positioning matters. Your chart and your rules decide the trade.
Made for NQ and ES day trading, tested on our own sessions – numbers first, no hype.
Access by invitation while we grow. Your feedback shapes what comes next.
The beta is small on purpose. Leave your email and we send you an invitation link when a spot is free.